Creating a Dashboard
If you highlight a DataBlock you will see the option to create a new report in the detail pane.
You can also right-click on the DataBlock and go to New Report. The Create a New Report dialog box appears. Give the report a name and a description if desired.
Next, choose what kind of report you want to create: CSV, banded, extract, or crosstab. There is also an option to create a new dashboard. As you select each report a description of the report type is shown to the right. (Select Dashboard). If the DataBlock does not contain a report query, the CSV and banded reports are not accessible and will be grayed out.
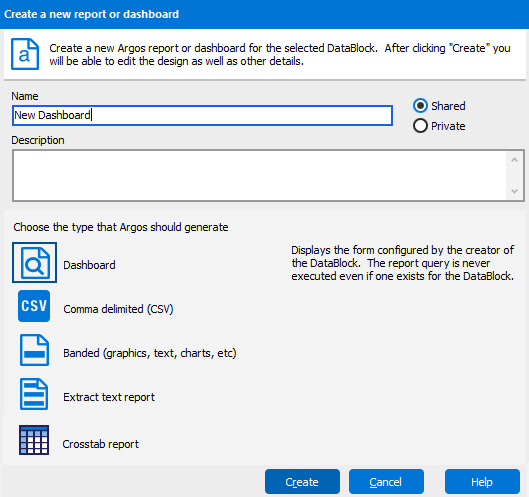
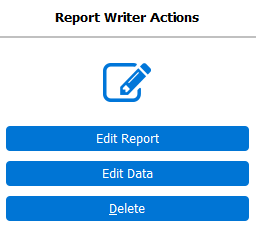
Select Dashboard, then click Create. Select the new report in the Explorer Tree to see options in the Action Area under Report Writer Actions. You can Edit the Report, Edit the Data, and Delete the Report. The Edit Data button is for XML experts who want to edit the underlying object XML.
In the Action Area, above the Report Writer Actions, you can see the name of the dashboard or report along with a description. Click the "i" icon ![]() in the corner to view information on when the report or dashboard was created, when it was last modified, and by whom it was modified.
in the corner to view information on when the report or dashboard was created, when it was last modified, and by whom it was modified.

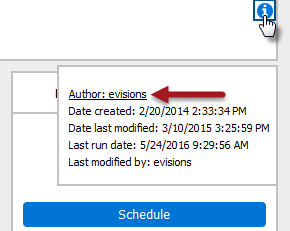
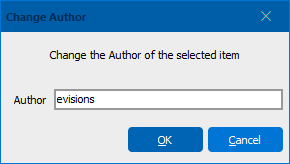
You can also edit the author of the report or dashboard by clicking on the author's name in the small pop-up that appears. Clicking on the author's name launches a dialog that will allow you to change the author's name. By default, Argos sets the author as the user who created the report.
Dashboards are shortcuts to the form created by the DataBlock Designer, so there isn’t much more you can do other than create it. If you click Edit Dashboard you can edit the dashboard. The Design button is grayed out and you don’t have access to it. There are a few tabs: the Refresh, API, and Saved States.
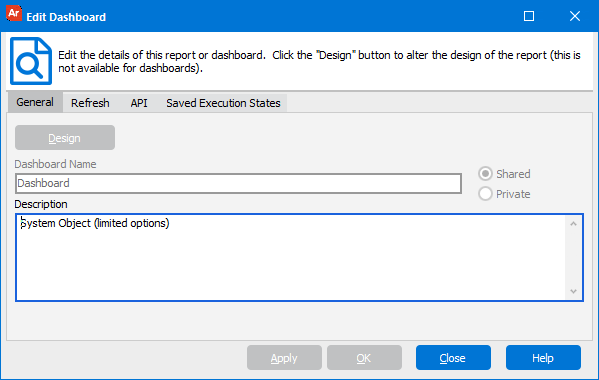
Once you have created your report or dashboard, you can find it in the navigation area.

Refresh Tab
The Refresh tab allows you to refresh the variables within the DataBlock. This is mostly only useful for Dashboards.
API Tab
The API tab is part of the optional Advanced Reporting module. API stands for Application Programming Interface which allows a report to be called from a web page or portal, or even a third party application. Only Administrators can configure and access the API tab. Making a report API accessible is a very useful feature when you want people to have access to a report created by Argos, but you don’t want to give them Argos access. All the different types of reports, Dashboard, CSV, Banded, and Extract can be called using the API. Making a report API accessible does have significant security implications, which is why it can only be done by an Administrator.
Saved Execution States Tab
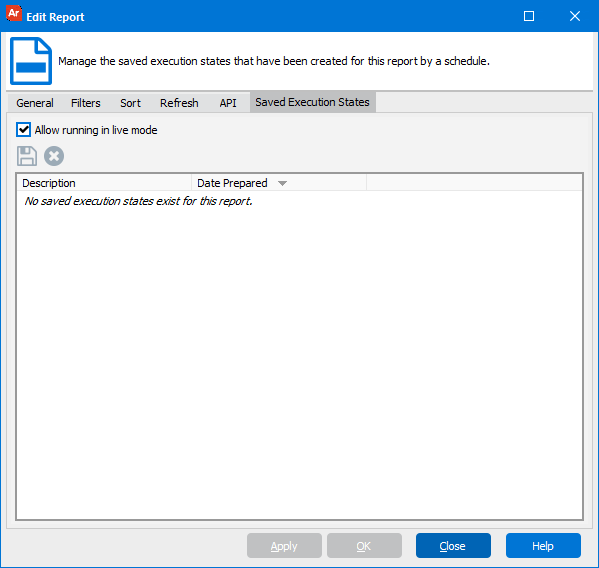
The last tab is the Saved Execution States tab. A saved execution state is a point in time snapshot of a dashboard or an OLAP cube or chart. The data is saved as a file that can be viewed at any time. Saved execution states are configured via the scheduler by an Argos Administrator or a DataBlock Designer. As a Report Writer you can allow or disallow the running of the dashboard by checking or un-checking this box.
You can also manage the saved execution states files by deleting any that you don’t want. The states shown are stored on the MAP Server, however you can also copy a saved execution state onto a PC by clicking the ‘Save’ icon. You will then be able to supply the destination and file name of the saved execution state.
The Report Viewer can choose whether to execute a state stored on the MAP Server or one stored on any PC. The Argos Report Viewers Guide provides an explanation of this.
Executing a Dashboard
After making the desired changes within any of the tabs described above, click OK to complete the creation of the report.
The Dashboard will now appear under the associated DataBlock and can be executed by selecting the appropriate action listed under Report Viewer Actions. Execution options are fully explained within the Argos Report Viewers Guide.